Tap the map. Grade your water.
Water Health Check turns thousands of real USGS field samples into an instant A-F water grade for anywhere on Earth: hardness, a health rating, and 24 chemicals compared against EPA limits.
Free on iPhone. No account, no ads, no data collected - just tap the map.
What the app does
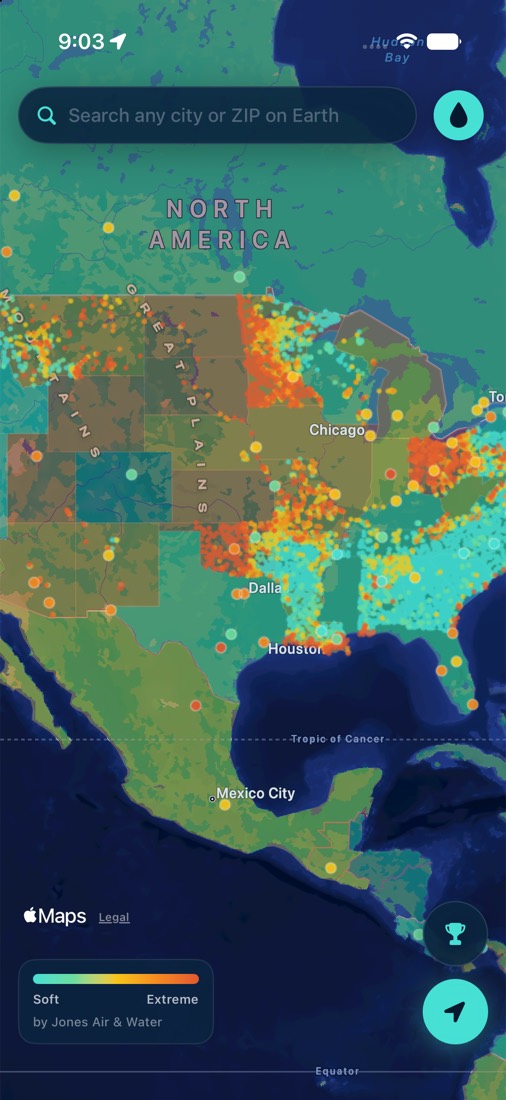
A shaded world map
Every US state and every country carries a hardness tint at every zoom level, with 8,900+ measured USGS readings and 200+ world cities drawn on top. No blank spots.
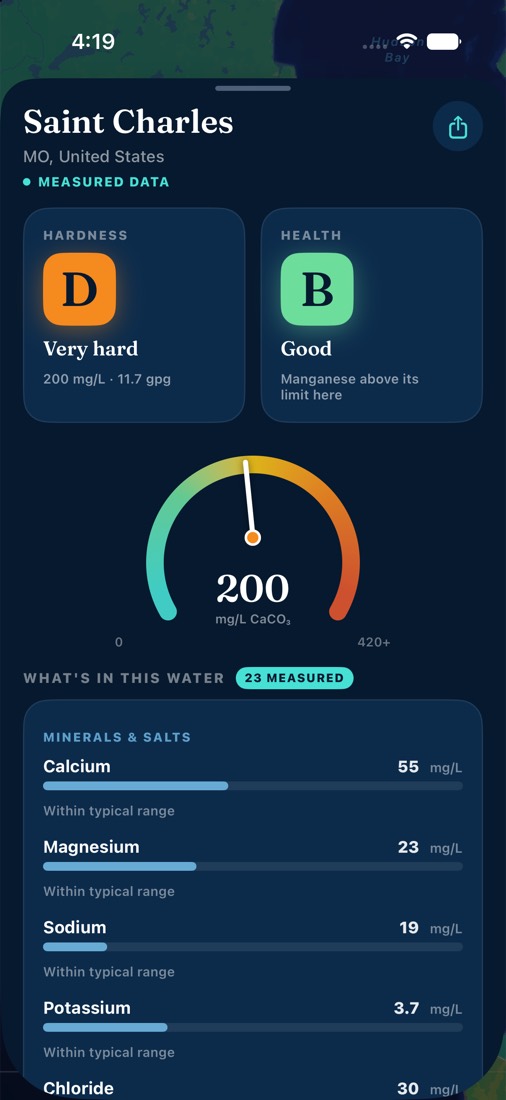
Two grades per tap
A hardness grade (soft to extremely hard, in mg/L and grains per gallon) plus a health rating scored from measured chemistry against EPA limits, with the driver named in plain English.
24 chemicals, one chart
Calcium to uranium: each chemical gets a bar against its EPA limit or typical range, so "iron at 82% of the guideline" reads at a glance.
Best-water rankings
The softest-water US states and the best-water cities per country, ranked from real readings, with medals. Settle the argument.
Honest data, labeled
Every reading is badged: measured (USGS field samples), utility reported (published water quality reports), or regional estimate. Readings are area-level source-water data, not a certified test of your tap, and grades reflect mineral content and EPA comparisons, not drinking safety.
Questions
Is it really free?
Completely. No account, no ads, no tracking. It is built by Jones Air & Water, the water treatment family serving greater St. Louis, because people who understand their water tend to fix it.
Where does the data come from?
The USGS/EPA Water Quality Portal (field samples aggregated by area), public utility water quality reports, and labeled regional estimates for the rest of the world.
Does it work outside the US?
Yes. Search any city or ZIP on Earth. US areas carry the densest measured data; international readings use utility reports and clearly labeled estimates.